What is the best type of tree to plant to save the planet?
The question of whether there is a particular type of tree that is best for the environment is one that we get asked quite often and giving an answer, based on strong evidence, is harder to do than you might think.
The answer is that it is complicated and that it depends on what you take into account. Carbon stored – yes, probably. Timber produced – yes, probably too. What about how long that timber might last and continue to lock up the carbon inside it? What is the use of the timber – construction timber stores carbon for the lifetime of that building, whereas wood logs emit the stored carbon when they are burnt. What about wildlife and habitat?
The good news is that there is more research and more tools available – like the Forestry Commission’s Ecological Site Classification tool and the Woodland Carbon Code (a quality assurance standard for woodland creation projects in the UK) – that help answer this question.
In addition, Forest Research, Great Britain’s principal organisation for forestry and tree-related research, has published an interesting study of the differences in carbon stored and released in two quite different woodland:
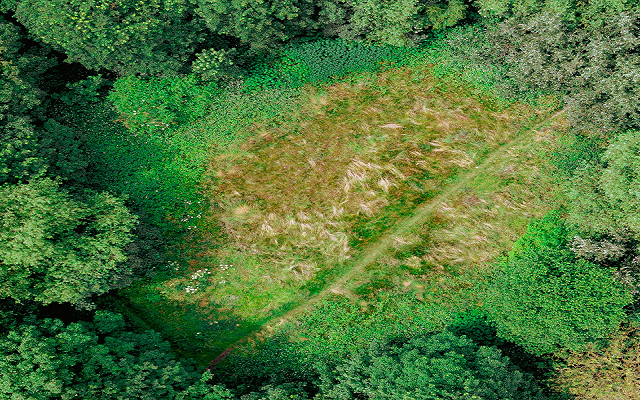
- A mature broadleaved – oak – woodland in lowland England
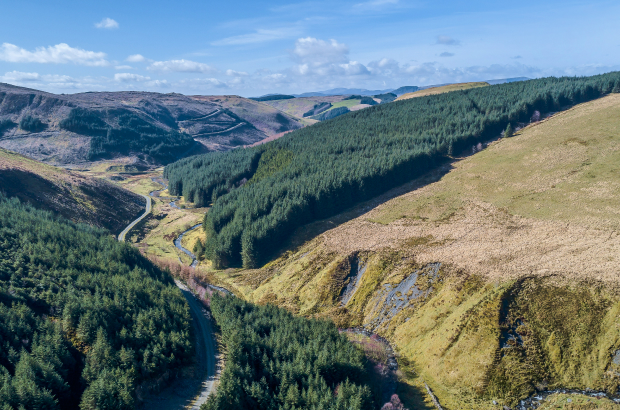
- A 50-year-old conifer – Sitka spruce – plantation in Northeast England.
Studies of this type are scarce under UK conditions, so it is a very useful addition to the evidence that we have on how different types of woodland take in, and release, carbon. The full paper can be seen in The carbon balances of two contrasting forest stands.
What did the research find?
It broke carbon down into two parts – the change or flux each year and the total stock of carbon in the woodlands.
In terms of fluxes, the Sitka spruce site absorbed over 50% more carbon dioxide than the oak plantation in the year studied.
This is shown as Net Ecosystem Productivity (or NEP) in the table, which is the difference between the rate of CO2 absorption by the forest through photosynthesis (GPP) and the rate of release by the respiration and decomposition processes (RECO).
The spruce absorbed more CO2 over the year (84.6 tonnes of CO2 per hectare) and this outweighed the higher release of CO2 from its foliage. The spruce also had lower CO2 emissions from decomposition from the forest floor.
In terms of the total stock of carbon held in the trees, understorey and soils, there was a similar story of greater carbon storage by the spruce plantation.
The stock in the above- and below-ground biomass of the spruce trees was 1.7 times larger than in the older oak trees, due to due to higher number of trees per unit area and their greater girth per unit area.
The carbon-rich soils at the spruce forest also contained 2.5 times as much carbon as the mineral soils at the oak site.
So what?
Well, it feels like the spruce plantation won but the researchers stress that the results should not be used to generalise the merits of one woodland type over the other.
They say that it is useful for developing the models needed to assess the carbon benefits of different types of forestry, at other locations, taking into account variations between years, and also the response of forests to extreme weather events.
This feels like the right conclusion to come to. No species is suitable for all locations and the study focused on carbon, while decisions on what to plant are much more multi-dimensional and include soil, weather, habitats and wildlife, and potential end uses for the timber produced.
So, what is the best type of tree to plant to save the planet? It depends, of course. However, many more of the right trees, in the right places and for the right reasons would be a useful start.
| Values per hectare | Lowland deciduous oak plantation | Upland Sitka spruce plantation |
| Physical characteristics | ||
| Location | South East England | North East England |
| Soil type | Surface water gley | Peaty-gley |
| Planting year | 1920-1943 | 1973 |
| Tree density (stems/ha) | 275 – 300 | 1,348 |
| Mean diameter breast height (cm) | 26 – 30 | 24 |
| Timber (t C ha) | 50 – 58 | 88 |
| Carbon fluxes (t CO2 per ha per year) – Ecosystem-scale fluxes | ||
| Gross photosynthetic or primary productivity (GPP) | 71 | 85 |
| Respiration flux components | ||
| Forest floor respiration (inc. litter) | 38 | 24 |
| Foliage respiration (by difference) | 18 | 35 |
| Total ecosystem respiration (RECO) | 56 | 58 |
| Net ecosystem productivity (NEP = GPP – RECO) | 15 | 26 |
| Carbon stocks (t C per ha) (NB These figures are total stock figures, not annual change. Carbon stocks are measured in carbon (C), not carbon dioxide (CO2), as they are in the physical solid phase not as gaseous CO2.) | ||
| Tree C stocks (above ground) | 81 | 122 |
| Understorey C stocks | 8 | – |
| Tree C stocks (below ground) | 28 | 61 |
| Litter layer C stocks | 17 | 38 |
| Soil C stocks (to 50 cm depth) | 115 | 281 |
| Sum of carbon stocks (t C per ha) | 247 | 502 |
