Arable volatility budgeting tool highlights cashflow risks
Farming is always difficult to predict – as the old adage goes, when you plant your crops you do not know what you’re going to produce, you do not know how much you’re going to produce and you do not know what you will be paid for it. How many other industries could cope with so much uncertainty?
Successful farming businesses are built to withstand most of what can be thrown at them, but the changes the industry is seeing at present is almost unprecedented, and for some it will be painful. Not only is it in the teeth of the Government’s post Brexit agricultural transition which is seeing the main support scheme being rapidly withdrawn, but national and global events have pushed prices for all major inputs rapidly upwards, not least fuel, fertiliser and chemicals, but also machinery and labour and other overheads.
Thankfully for arable farmers grain prices have also increased owing to global concerns about access to adequate supplies (it is worth remembering that wheat prices had risen above £175/tonne in autumn 2020; well before the Russian invasion of Ukraine in February 2022).
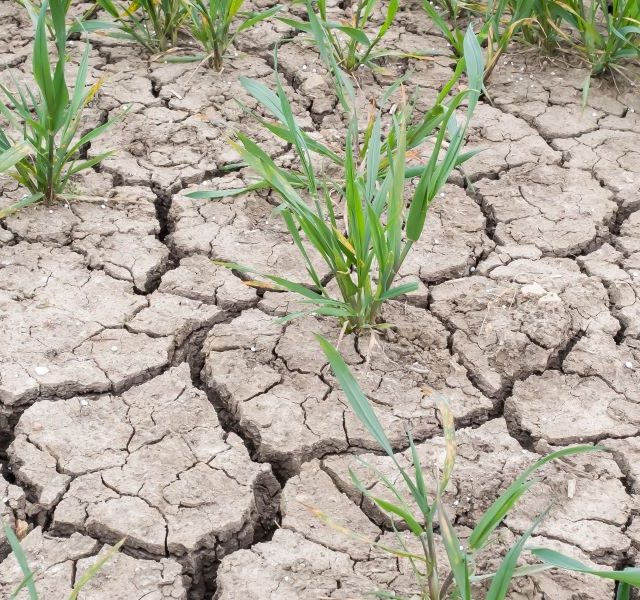
The significant changes that farmers have seen in input costs mean that producers are operating in a higher-risk environment than they have ever experienced. Successful businesses find ways to manage that risk, and budgeting and cashflow forecasting should be a vital part of anyone’s risk management strategy.
Our farming and research team has developed a new tool to help assess how sensitive the net margins are to changes in some of the main variables, such as fertiliser and diesel costs and crop sales values.
The spreadsheet uses the 2021 harvest year as its baseline and produces projections for the 2022 and 2023 harvests. It compares income, expenditure and profits for arable farms, using a ‘standard’ set of figures to provide a broad overview of the changing situation. However, its main value is seen when tailoring the figures to individual circumstances. Most of the variables can be changed including rotation, areas grown, yields, input and output prices so that the results can reflect most businesses. It produces figures for in-hand land, contract farming agreements and let land.
‘Standard figures’
For an initial quick glance, the tool contains ‘standard’ figures for all of the variables to produce standard receipts, costs and net margin figures automatically. Yields come from Strutt & Parker’s Yield Survey and contract farming charges from our Contract Farming Agreement Survey.
2021 baseline
1. The 2021 baseline shows a net margin, which can be considered the equivalent of profit, of £474/ha for in-hand land and £574/ha for a contract farming agreement (of which £418/ha is due to the farmer).
2. These figures are based on typical costs for the 2021 harvest (i.e., ammonium nitrate (AN) fertiliser at £275/t and red diesel at £0.70/litre), and an average wheat sale value of £180/t (from which the other crop prices are adjusted).
2022 projections
3. The variables that are used to make the ‘standard’ projections have been adjusted in a number of ways:
- Crop prices have been increased (to £260/t average wheat price).
- Basic Payments reduced to reflect the planned reductions.
- Agri-environment income unchanged as most new agri-environment schemes are not open.
- Seed costs increased (by 25%, linked to higher crop prices).
- Fertiliser costs increased (to £500/t average cost of AN, compared with £275 for 2021).
- Spray costs increased (by 20% to reflect changes in market prices).
- Diesel costs increased (to £1.00/litre for red diesel, compared with £0.70/litre for 2021. NB As many farmers have diesel stores, it is assumed that 60% of the diesel used is at the higher price).
- Labour costs increased (by 5%).
- Property and machinery maintenance costs increased (by 10%).
4. Using these assumptions, the 2022 ‘standard’ net margins have increased to £765/ha for an in-hand farm and £865/ha for a contract farming agreement.
5. This is a result of the increase in receipts being greater than the increase in variable and fixed costs.
6. For a typical sized in-hand arable farm, the working capital needed to pay for variable and fixed costs increased by @28% (from £123,000 (£939/ha) to £155,000 (£1,185/ha) for a farm with 131 ha of arable crops).
2023 projections
7. The variables for ‘standard’ figures have been again altered, with the most significant changes being:
- Crop prices have reduced slightly (to £250/t average wheat price).
- Agri-environment income increased (by 30% as some new schemes open).
- Fertiliser costs increased (to £650/t average cost of AN).
- Diesel costs increased (to £1.20/litre, for all diesel used).
- Labour costs increased (by 10%, compared with the 2021 baseline).
- Property and machinery maintenance costs (by 20%, compared with the 2021 baseline).
8. Due to costs rising and receipts slightly falling, the 2023 ‘standard’ net margins decrease to £517/ha for in-hand land (back to within 10% of the 2021 level) and £641/ha for a contract farming agreement.
9. As in 2022, the working capital needed to pay for variable and fixed costs is much higher, having increased by @43% compared with 2021 to £175,500 (£1,340/ha) for a farm with 131 ha of arable crops.
| ‘Standard’ receipts costs and net margins for in-hand farm with a typical combinable crop rotation |
| Harvest years |
| £/ha | 2021 | 2022 (Forecast) | 2023 (Forecast) |
| Output | 1,414 | 1,952 | 1,858 |
| Variable Costs | 452 | 653 | 745 |
| Fixed costs (excluding rent & finance) | 488 | 535 | 596 |
| Net Margin | 474 | 765 | 517 |
| Source: Strutt & Parker |
Conclusion
In the short term, high input prices appear to be covered by higher grain prices and many businesses will see some good results from the 2021 and 2022 harvest years. However, the cashflow effects of the higher costs we are seeing will need careful management, and this is particularly relevant to those businesses which are reliant on borrowings. The record low interest rates are now consigned to history and with inflation at 40-year highs interest rates look set to continue rising in the short term at least. For those reliant on variable rate overdrafts or loans the added interest costs will need to be factored in to cashflow forecasts.
Looking further ahead the outlook for the 2023 crop year is more uncertain, and as noted above the costs of producing a crop are forecast to be at record highs. Whether grain prices stay at current levels remains to be seen but farmers planting crops this autumn may wish to lock in a proportion of forward grain sales in order to lock into a reasonable gross margin. Any falls in grain price will put margins at risk, as will disappointing crop yields or crop failures.
Farmers are looking at various ways of mitigating input costs. On a basic level this might mean re-visiting the idea of organic manures including bio-solids to reduce the quantity of artificial fertilisers, or substituting ammonium nitrate with urea for part or all of the requirement. Reducing application rates may be justified depending on the ratio of grain to fertiliser price.
We are advocating a more proactive approach to soil testing to include in some cases soil mineral nitrogen testing, as this can provide a more accurate assessment of nitrogen held within the soils. In the past it may not have been cost effective but if this can lead to a justified reducing in fertiliser use then it will pay for the cost of the testing many times over. Farmers and contractors will also be continuing to look at their cultivation practices to see whether there are more efficient ways to create a seedbed. Whilst important to explore, the importance of achieving the optimum yield remains key to success and so, despite the obvious concerns over cost of diesel and equipment, there should be no cutting of corners when it comes to crop establishment.
The 2023 ‘in-hand’ figures show the effect of the declining BPS too – forecast in the standard figures to be only 8% of total revenue compared to 15% of revenue in 2021. In terms of net margin, using the standard budget figures the BPS makes up 46% in 2021 compared with 29% in 2023. The true effects of the withdrawal of BPS are insulated during this period of high grain prices, but should markets fall, the loss of BPS will be painfully felt.
If you would like one of our farming team to run your figures and rotation through our calculator, please contact rural.enquiries@struttandparker.com Alternatively contact Andrew Atkinson or Jason Beedell.